
A bar graph is a pictorial representation of data in the form of bars or buildings on a graph. Banking exams such as IBPS PO, SSC, IBPS clerk, etc. will have a special focus on the data interpretation. Every year there are 3-4 questions on this topic in such exams. Let’s see the different types of questions and methods to solve them accurately.
Bar Graph
A bar graph is nothing but a pictorial representation of data wherein every independent variable attains only discrete value. They are used for representing various types of data.
The bar graph is one of the frequent methods used to present various types of data. It is usually asked in the data interpretation section of the competitive exams. In data interpretation, it is the representation of data where the vertical bars are placed at equal distance from each other. The value of the data represented is given by the height and length of the bars. The width here is not important it is only used so that the presentation is clear.
They are plotted against the horizontal axis known as the x-axis. The value can be shown by coloured or shaded vertical bars of equal width. In a horizontal bar graph, the values are plotted against the vertical axis called the y-axis. They are commonly used as the data can be easily analyzed.
Types
There are types of bar graphs used to represent the data. They are as follows.
1. Simple bar graph
2. Composite bar graph
3. Stacked bar chart
4. Bar charts to show deviation
Simple Bar Chart
As the name suggests simple bar chart is the simplest bar graph of all. It is used to describe one continuous variable along with the one discrete value. The figure below shows the proper representation of a simple bar chart.

Composite Bar Chart
To solve the limitation of simple bar chart composite bar chart is used. We use a composite bar chart to show two or more than two continuous variables on the same graph. This is the figure below that describes how a composite bar-chart looks like.
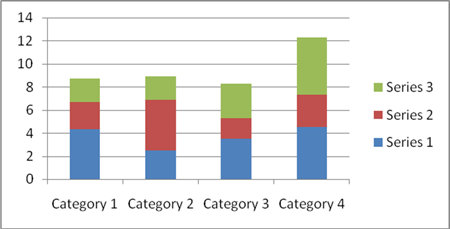
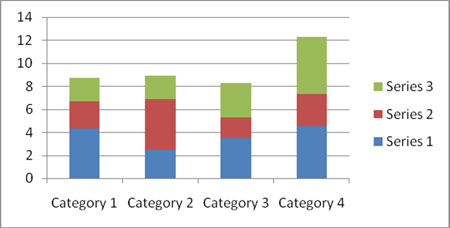
Stacked Bar Chart
Stacked bar charts are used to represent the break-up of the content for continuous variables. It is very convenient to use it for comparing different sets of data. It can be used to represent factors such as revenues, profits, losses over a period of couple years. The figure below describes the same.
Bar Charts to Show Deviation
Mostly bar charts are used to show the deviation. And that is why the bar charts that are used to show the deviation are very common. Deviation charts can show the deficit as well as the surplus, imports, and exports, etc. It is usually required to represent the positive as well as negative values of the continuous variables.
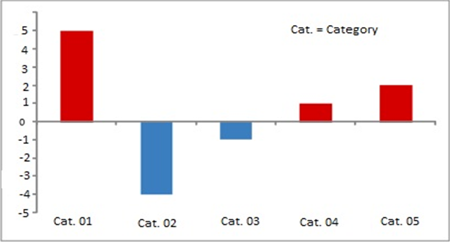
As shown in the figure a baseline is created wherein the positive values are shown above the line while the negative values are shown below the line. Answer the questions based on the given figure below.

Q. Out of the given years, in how many did the export was more than 10% as compared to the import?
A. 1 B. 2
C. 3 D. 4
Answer: In the year 2000, exports were 60 while the imports were 50. So 10% of 50 is 5. And thus the total will be 55. Here 60 > 55. Similarly in 2001, 110 = 10% of 100.
In 2002, 120 < 130. For 2003, 120 > 10% of 100. For 2004, 150 < 10 % of 140.
In 2005, 190 < 10 % of 180. So there are years i.e. 2000 and 2003 where exports were 10 % greater than the imports. So the correct answer is B.
Q. For all the years mentioned what is the average of the exports?
A. 110 B. 120
C. 125 D. 130
Answer: Here from the figure the average of the exports will be: (60 + 110 + 120 + 120 + 150 + 190)/ 6 = 125. So the correct answer is C.
Q. From the numbers given in the figure below, what will be the average annual growth for the imports done from 2001 to 2005?
A. 11 B. 12.5
C. 13.5 D. 14.5
Answer: Imports done in 2001 = 110
Imports done in 2005 = 190
So, the annual growth = (190 – 110)/110 * 100 = 72.72%
Now, the average growth will be 72.72/ 5 = 14.5. So the correct answer is D.
Q. From 2000 to 2005 in which was the growth in imports as compared to the previous years was the highest?
A. 2001 B. 2002
C. 2004 D. 2005
Answer: From the figure, we can determine that imports grew only in 2001, 2002, 2004, and 2005.
For 2001, (50 * 100) / 60 = 83.33
For 2002, (10 * 100) / 110 = 9.09
For 2004, (30 * 100) / 120 = 25
For 2005, (40 * 100) / 150 = 26.66
Thus the correct answer is A. This type of questions can be solved quickly if you compare the base for every year. Here for 2001, the base value is 60 and thus chances are high the growth in 2002 must have been higher. You can look for this in the exams and start by solving 2002. This will save a lot of your time.
Q. In how many years does the export as well as import increases as compared to the previous years. And among them, in how many years was the percentage increase in export was greater than the percentage increase in imports
A. 0 B. 1
C. 2 D. 4
Answer: Out of all the years given in the figure, the imports and exports as compared to the previous are increased in every year except 2000 and 2003. Out of the four in which imports and exports have increased, in no year does the percentage increase in export is greater than the percentage increase in imports. Thus the correct answer is A.
Practice Questions
Q. In the following graph, the increase in the wheat over years is shown. Based on this answer the questions below.

1. How much does the wheat grow in 1994 as compared to the previous year?
A. 12.2% B. 13.6%
C. 16.1% D. 17.8%
Ans: The correct answer is C.
Q. What was an increase in the average rate of growth of wheat from 1993 to 1995?
A. 13% B. 12%
C. 14% D. 16%
Ans: The correct answer is D.
Q. How much percentage of growth of wheat was less in 1994 as compared to 1993?
A. 13.9% B. 12.2%
C. 11.9% D. 14.6%
Ans: The correct answer is A.
Q. What was the average of the total wheat, grew from 1995 to 1997?
A. 22 tonnes B. 26 tonnes
C. 28 tonnes D. 25 tonnes
Ans: The correct answer is B.